
Sky bike lanes to reduce private cars on the road by 24 to 33%
Majority of Metro Manila residents favor sky bike lanes
[Note: This is a repost of my article, which was also published in Linkedin. This article is based on (with many portions directly lifted from) my thesis (special problem) for the Master of Environment and Natural Resources Management program of the UP Open University.]

METRO Manila is indeed among the most congested cities in the world. A study made by Japan International Cooperation Agency (Jica) has estimated that losses from traffic congestion in Manila could reach up to P6 billion per day in the next fifteen years (Jica, 2014).
MEANWHILE, a World Bank study in 2004 estimated that PhP 910 million was spent on hospitalization and medical expenses for the treatment of non-communicable diseases that include acute lower respiratory infection/pneumonia, chronic obstructive pulmonary disease, and cardiovascular diseases.
DEALING with traffic congestion entails interventions in several fronts, particularly, in policy, infrastructural, and behavioral dimensions. This study is focused on the infrastructural dimension with the caveat that the other dimensions should also be equally addressed if Metro Manilans are to effectively address the issue.
A simple policy-based solution to the traffic condition is to lessen the number of vehicles on the road particularly given that the road network is not catching up significantly with the increase in vehicle and population. This is already being addressed by policies such as the number-coding scheme. This helps but other solutions are clearly required.
A preliminary study had been undertaken and considers an infrastructural approach as a support mechanism for policy- and behavior-based interventions. It looks at the construction of sky (elevated) bicycle (bike) lanes in Metro Manila, with the assumption that it can help reduce the number of motorized vehicles on the road, and, consequently, reduce congestion and carbon emissions, thereby contribute to climate change mitigation.
THIS initial work—envisioned to contribute to future pre-feasibility and feasibility studies—considers the likely impacts of this intervention, estimating the impacts through reduction of motorized vehicles and carbon emissions. The results of the preliminary study—based on a survey with 250 respondents and complemented by relevant work all over the world—support the case for the construction of a well-integrated network of bicycle lanes (with most of them elevated) as this will likely result to the 24 to 33.37% reduction of private motor vehicles on the road, leading to the potential decrease in greenhouse gas emissions of about 2.23 to 4.46 millionmetric tons CO2e annually by year 2030. This is roughly the same amount of carbon that can be sequestered by 57.76 to 115.54 million tree seedlings grown for 10 years.
Majority of Metro Manila residents favor sky bike lanes
THE survey also revealed that there is an overwhelming support on the building of sky bike lanes in Metro Manila based on the number of respondents who said that they like the idea—221 people, representing 88% of the total respondents (n = 250). With the high number of supporters and potential bikers, the question that comes to mind is, “Why are there so many people not biking to work/school these days?” The question had been answered by the survey as well.
Safety as a major deterrent
FOR current non-bikers, safety concern is the top reason why they do not want to bike. In the question, “If you answered NO above (#4 in the questionnaire), what is the main reason why you don’t bike or don’t like biking?”, 57 persons (38%) said they are concerned about road safety. The next top concern is on possible health impact (e.g., poor air quality) (Figure 1).

THESE results are consistent with studies in other countries. In what could be among the most extensive studies on biking, Monsere et al. (2014) worked with the US National Institute for Transportation and Communities (NITC) and National Association of City Transportation Officials and considered the importance of segregated bike lanes.
THEY saw that safety concern is indeed a major deterrent toward the use of bicycles. Their studies, along with work of other experts in the field estimated that many (e.g., 60% of the US population) are “interested but concerned” but that 81% of this segment will likely feel “comfortable” on streets with a separate bike lane. Interestingly, if we will add 38% (concerned about road safety) and 24% (concerned about health impacts) from this survey (proposed Sky Bike Lanes for Metro Manila), they will add up to 62%–which is close to the result (60%) in the US. Certainly, there is another layer of complexity about safety concerns and a simple mathematical solution is not going to resolve that. Nevertheless, it is safe to say that there is a universal truth about feeling scared on the road if one is biking (unprotected) in busy roads.
SIMILARLY, Fraser and Lock (2011), undertook a systematic review of literature, which analyzed the impact of built environment, for example, dedicated bicycle routes, toward increase in cycling in a given society or population. Their review of 11 studies showed that environmental factors indeed had a positive association with cycling. This means that factors such as presence of dedicated bicycle lanes, separation of cycling from other traffic, short distances (e.g., from home to school) contribute to people’s willingness and decision to bike.
Two to 4 car owners (out of 10) will leave cars behind if there are sky bike lanes
BASED on the Metro Manila survey, 43 (42%) car owners indicated the desire to use the bike lanes “all the time or often (e.g., at least three times a week).” By adding those who indicated using them “occasionally (or at least once a week)” (13%) and “every now and then” (35%), there is a potential of 90% of car owners using the bike lanes in varying frequency.
BASED on the study’s estimations (using projections undertaken by Jica in 2014), there is a reduction of volume by 24% by 2020. This means that 2-3 out of 10 persons who own cars will likely bike to work/destination by 2020 if there is already a good network of sky bike lanes by then.
USING a second set of scenario (where there will be more bikers), there will be a likely reduction of private car volume by 33.37%. Again, this means that that 3-4 out of 10 persons who own cars will likely bike to work/destination by 2030 if there is already a good network of sky bike lanes by then.
MEANWHILE, the estimated reduction in greenhouse gas emissions (GHGs) of about 2.23 to 4.46 millionmetric tons CO2e annually by year 2030 is better illustrated by using the US EPA online Greenhouse Gas Equivalencies Calculator (USEPA, 2017). Clearly, the estimated reduction of carbon emissions that the proposed sky bike lanes will likely contribute is significant. For example, the volume of reduction is the same as the amount of emissions that may be sequestered from roughly 57.76 to 115.54 million of tree seedlings grown for 10 years (Figure 2).
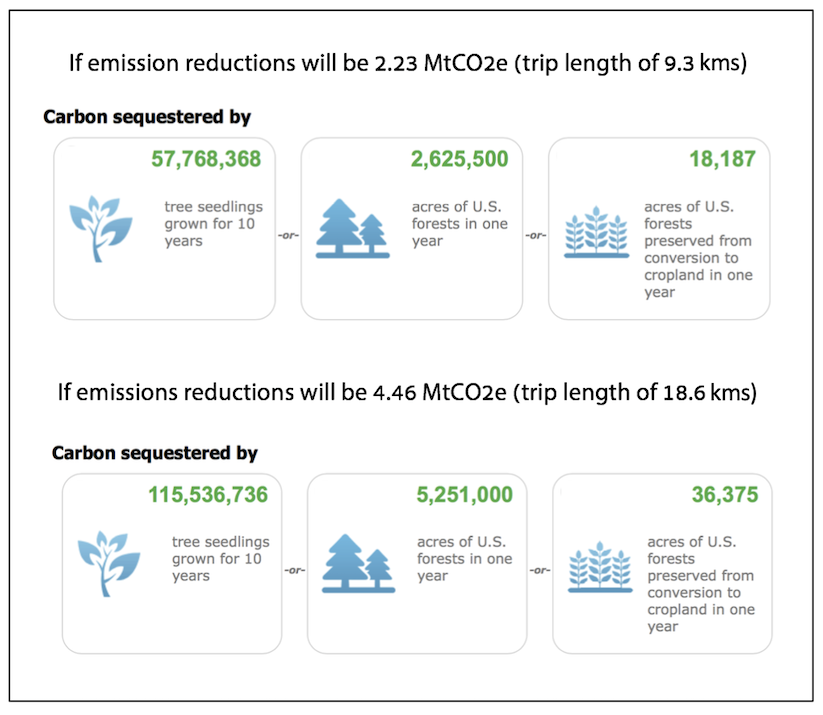
[Source: US EPA, 2017]
Sky bike lanes in other countries
THE construction of sky (elevated) bike lanes is a fairly new intervention. There is no official count available online but there could be about ten (10) elevated bike lanes all over the world so far with about four (4) of them under construction or in the planning stage. Nevertheless, this preliminary study—despite its focus on a relatively novel idea—will, hopefully, contribute to continuing discourses and encourage more research work on the effectivity of segregated, specifically, elevated bike lanes, for cities like Metro Manila—where there is no longer much space on the ground for any massive infrastructural intervention.
ONE of the more popular sky bike lanes is the Cykelslangen (Bicycle Snake) in Copenhagen, Denmark. This is constructed over the Copenhagen Harbor, 4-meter wide (with two lanes) and 230-meter long. It is about 5.5 m in height from the quay and used by 12,500 bikers/day. It cost the Danish government about US$6.6 million to construct.
![Cykelslangen (Bicycle Snake) in Copenhagen, Denmark. [Image courtesy of Dissing+Weitling Architecture]](http://annasuarin.com/wp-content/uploads/2018/07/Cykelslangen-in-Copenhagen-Denmark_Dissing-Weitling-architecture.jpg.png)
MEANWHILE, the Bicycle Skyway in Xiamen, China, is probably the latest to be built, with the government opening it to public in early 2017 (Travers, 2017). The elevated bike lane—inspired by a concept by middle school students who won in a local science and technology competition—straddles over five residential areas and three business districts. The bike lane can be reached through 11 entrances, which also connect to the same number of bus stops and two underground rail stations (Johnston, 2017). It took safety considerations very seriously by installing 30,000 lights and automated gates that help monitor flow and capacity (Johnston, 2017).
![The newly-build elevated bike lane in Xiamen (China)—at 8 km, it is touted to be the longest so far in the world. [Image courtesy of E. Johnston/Road.cc]](http://annasuarin.com/wp-content/uploads/2018/07/Sky-bikelane-in-Xiamen-China_Image-E.-JohnstonRoaddotcc_jpg.png)
ANOTHER good example is the 1-km shared bicycle lane and walkway that has transformed the urban landscape of this part of Auckland, New Zealand. Called,Te Ara I Whiti (Light Path), it is found in Nelson Street andhas received international recognition in the World Architecture Awards in 2015. Its name was inspired by the integration of LED mood lights that keep on changing colors.
![Te Ara I Whiti (Light Path) in Auckland, New Zealand. [Image and data courtesy of GHD, Katz Maihi and Iwi, Monk Mackenzie Architects, LandLab, and Novare]](http://annasuarin.com/wp-content/uploads/2018/07/Te-Ara-I-Whiti-Light-Path_Auckland-NZ_Image-GHD-Katz-Maihi-Iwi-Monk-Mackenzie-Architects-LandLab-Novare.jpg.png)
The case for segregation
ZIEMBA, Mitra, and Hess (2012) looked at the important question on segregation and their study revealed that there was indeed an increase in the number of bikers when bike lanes are physically separated and improved. The improvement in the design of a bike lane in Sherbourne Street (downtown Toronto) led to an increase in the number of bikers, where almost 24% of the respondents who are newbikers shifted from driving. Meanwhile, Strauss and Moreno (2013) undertook a study in Montreal and found that 61% more cyclists are found in intersections that have segregated bike lanes than in street corners without.
A comprehensive study for the NSW Long Term Transport Master Plan(State of New South Wales through Transport for NSW, 2013) with over 1,200 submissions revealed that 70% of NSW residents indicated that they will likely bike more if it was safer and more convenient. The strategies outlined are evidence-based, indicating, for example, that comparing the number of vehicles and bicycles in a particular street with segregated bike lane during a peak hour (8:00 to 9:00 am), more number of people are traveling by bicycles.
THE results of this study as well as other reports became bases for the strategy paper developed by the National Roads and Motorists Association of Australia (2015), which also favor the construction of separated or segregated bike lanes that are intelligently located and form a grid. This means that bike lanes should be continuous (as against disconnected). The Association emphasized that “more continuous separated routes will make cycling a more attractive option and reduce the safety risks associated with funneling cyclists onto roads where cycle paths suddenly end.
MEANWHILE, a study by Teschke et al. (2012) compared roads with and without segregated bike lanes and the results showed a reduction in the risk of crashes by nine (9) times. Buehler and Dill (2015) undertook extensive literature review and came to the conclusion that many of existing research work do suggest that a high percentage of people favor “separate paths and/or lanes over cycling in roadways with motorized traffic — particularly with high volumes of fast-moving motorized traffic. Among bike facilities, cyclists and non-cyclists seem to prefer physically separated bike paths or cycle tracks to bike lanes or wide shoulders on roadways.”
ASIDE from safety considerations, impact on reduction of motorized vehicles (consequently, carbon emissions) is indeed very significant. Experiences in other countries show that biking (in some countries, along with walking) has a direct impact on the decrease of motorized vehicles on the road. In Netherlands—where biking registered a 30% share in total travel mode—car use is only at 45%. Compare this in a country like the US—where biking share is only at 1% (the lowest among the countries in the list)—car use is as high as 84%, generating the highest share. This was reiterated by Gosse and Clarens (2013) who highlighted that providing people with better bicycle facilities is an initiative that can increase share of non-motorized vehicles in the modal share without requiring huge investments.
THEREFORE, empirical data point to decline in motorized vehicle use where there are good systems and infrastructure such as segregated bike lanes, metro (subway), and sidewalks. While there is still a need to keep on analyzing experiences and validating data, such numbers should guide policymakers and decisionmakers in planning their cities particularly when it comes to transportation infrastructure.
THERE is no extensive study in the Philippines yet on the extent of biking although a study by Gozun and Guillen (2008) estimated that only around 2% of all trips in Metro Manila are made by bicycles. Latest statistics show a very high share of private cars at 71.3% by vehicle trips and 31% by modal share (Jica, 2014). The non-inclusion of biking in many transportation-related studies reflects that the extent of biking—while showing increasing trend in many countries and cities all over the world—is still low in the Philippines.
Study limitations
THE survey is still currently open so as to ensure a robust analysis during the pre-feasibility and feasibility stages. Therefore, while diligent efforts had been exerted to cross-reference the initial results[1], assumptions, and analysis here with others’ work in the field, the calculations from the survey data shall be continuously enhanced in future work (and, at the current stage, should be used with caution).
NO substantial data and analytical work are available on biking in the Philippines, much more, from peer-reviewed journals. Therefore, the author had to rely more on work in other countries. This poses limitations because conditions (e.g., climate) in other countries are very different. Nevertheless, this must be taken as a continuing challenge for researchers not just in the Philippines but all over the world.
THIS is an initial work on scenario development so focus is on preparing the ground work for better and more robust scenario building. As the sample size is smaller than the ideal, some data (e.g., anticipated distance to be covered by potential bikers) had not yet been utilized in anticipation of the more complete survey.
Paving the path toward urban renewal
CLEARLY, the preliminary results and existing literature support the case for segregated bike lanes—where sky bike lanes fall under—and which are expected to encourage more bikers on the road (with many of them hoped as previous car owners). However, a robust feasibility study is crucial in order to ensure viability.
THE traffic problem of Metro Manila requires multi-faceted solutions and the building of sky bike lanes alone will not solve it completely. Nevertheless, it is very crucial that the solution should include an intervention to lessen the number of motorized vehicles on the road—and increasing bikers on the road, along with effective and efficient mass transport systems, will help in ensuring this.
HOWEVER, in the case of the Philippines, there is much to be done. The country has been “under-building” (e.g., mass transport systems) for the past decades but building too much in areas where they are aggravating congestion problems (e.g., shopping malls in central business districts). The traffic problem (and the bigger part – urban decay) can only be addressed through multi-pronged interventions where both behavior and policies inter-weave.
MORE studies need to be to undertaken. It is ironical that with the gravity of the problem, substantial work and investigation still need to be done particularly with non-motorized transportation. The massive transportation challenges in Metro Manila can only be solved through a holistic approach where policy-, infrastructure- and behavior-based interventions are done comprehensively and systematically.
CONSTRUCTING elevated bike lanes is an infrastructure-based intervention. It is not the end-all-be-all type of solution but the results of this study show a huge potential for reducing traffic gridlocks and massive congestion in Metro Manila—a reduction that will ultimately result to lasting socio-economic and environmental impacts including reduction in greenhouse gas emissions.
WHILE this is just a preliminary work for the bigger task ahead, it is hoped that this work becomes a basis for a more in-depth analysis of elevated bike lanes and a tool for policymaking, advocacy, and resource mobilization for the next stages.
[1] Based on 250 responses in the survey administered via Google forms (with cut-off date of 23 October 2017).
References:
Buehler, R. and Dill, J. (2015). Bikeway networks: A review of effects on cycling. Retrieved from https://ralphbu.files.wordpress.com/2016/04/buehler-dill-treviews-2.pdf
Dissing+Weitling Architecture. (n.d.). The Bicycle Snake. Retrieved from http://www.dw.dk/cykelslangen-bicycle-snake
Fraser, S. & Lock, K. (2011). Cycling for transport and public health: A systematic review of the effect of the environment on cycling. Retrieved from https://academic.oup.com/eurpub/article/21/6/738/493197/Cycling-for-transport-and-publichealth-a
Gosse, C. & Clarens, A. (2013). Quantifying the total cost of infrastructure to enable environmentally preferable decisions: The case of urban roadway design. Retrieved from http://iopscience.iop.org/article/10.1088/1748 9326/8/1/015028;jsessionid=545D4ACFA221562D900B3D2EA3F800F3.ip-10- 40-1-105
Gozun, B. & Guillen, M.D. (2008). Towards a Sustainable Transportation Environment: The Case of “Pedicabs” and Cycling in the Philippines, Thirteenth CODATU Conference of Urban Transport (CODATU XIII), Vietnam, 12-14 November 2008.Retrieved from http://www.codatu.org/wp-content/uploads/Towards-a-sustainable-transportation-environment.-The-case-of-Pedicabs-and-cycling-in-the-Philippines-Brian-GOZUN-Marie-Danielle-GUILLEN.pdf
Japan International Cooperation Agency. (2014). JICA transport study lists strategies for congestion-free MM by 2030 [Press Release]. Retrieved from https://www.jica.go.jp/philippine/english/office/topics/news/140902.html
Johnston, E. (2017). Longest elevated cycle path opens in China [Blog Post]. Retrieved from http://road.cc/content/news/217380-longest-elevated-cycle-path-world-opens-china
Monsere, C., Dill, J., McNeil, N., Clifton, K., Foster, N., Goddard, T.,…Parks, J. (2014). Lessons from the green lanes: Evaluating protected bike lanes in the US(through Portland University, commissioned by the US National Institute for Transportation and Communities). Retrieved from https://bikeportland.org/wpcontent/uploads/2014/06/NITC-RR583_ProtectedLanes_FinalReportb.pdf
National Roads and Motorists Association. (2015, March). Cycling strategy: A new vision for cycling in NSW.Retrieved from https://www.mynrma.com.au/images/About-Education/NRMA_Cycling_Strategy_-_March_2015.pdf
State of New South Wales through Transport for NSW. (2013, December). Sydney’s cycling future– Cycling for everyday transport. Retrieved from http://www.transport.nsw.gov.au/sites/default/files/b2b/publications/sydneys-cyclingfuture-web.pdf
Teschke, K., Harris, A. Reynolds, C., Winters, M., Babul, S. Chipman, …Cripton, P. (2012). Route Infrastructure and the Risk of Injuries to Bicyclists: A Case-Crossover Study Retrieved from https://www.ncbi.nlm.nih.gov/pmc/articles/PMC3519333/
Travers, J. (2017). World’s longer aerial bike path inspired by middle school students. Retrieved from https://www.ecowatch.com/aerial-bike-path-china-2261408355.html
US Environmental Protection Agency. (2017). Greenhouse gas equivalencies calculator. Retrieved from https://www.epa.gov/energy/greenhouse-gas-equivalencies-calculator
World Bank. (2004). Philippine Environment Monitor 2006. Retrieved from http://siteresources.worldbank.org/INTPHILIPPINES/Resources/PEM06-chapter3.pdf
Ziemba, R., Mitra, R., and Hess, P. (2012). Mode substitution effect of urban cycle tracks: Case study of a downtown street in Toronto, Canada. Toronto: Ryerson University. Retrieved from http://www.ibiketo.ca/sites/default/files/Ziemba_mitra_hess_trb%20poster%202016.pdf
Mama Earth loves you: To maintain independence, this website is self-funded and this write-up is not a commissioned work. There is no request for donation but if you can plant a tree (or two!) on your birthdays, it will really be awesome and will make Mama Earth very happy! P.s. It’s better if you could join the You’ve Got TREE-mail! Chain.


Leave a Reply